Squadhelp is now Atom -- where everything starts!
Learn More
Purchase with an independent Escrow service. Your funds will be held securely by Escrow.com until the domain is successfully transferred.
Strong Buyer Interest 4+ potential buyers viewed or shortlisted this domain recently.


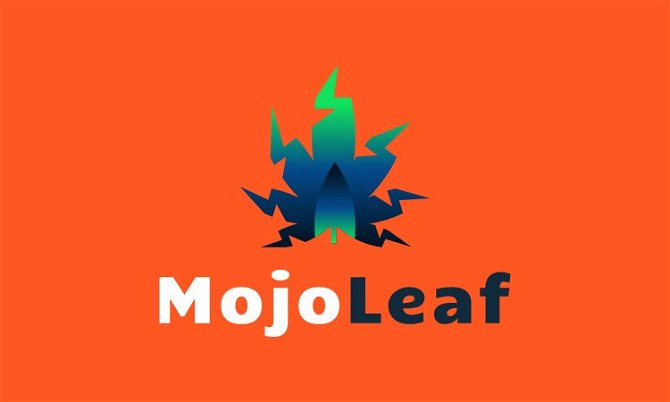
MojoLeaf.com is an 8 character domain name that encapsulates the feeling of natural vitality. The word "mojo" is derived from an African-American term for a special kind of power or charm, and the leaf imagery adds a natural and refreshing feeling to the domain. 8 character domains are desirable because they are easier to remember and type in, making them more attractive to potential customers. This domain could be used for a variety of products, services, or brands that are looking to evoke a sense of natural energy or power. Possible uses include health and wellness products, natural beauty products, or green technology companies.
Tell us about your business in a few words and check brand alignment
Purchase with an independent Escrow service. Your funds will be held securely by Escrow.com until the domain is successfully transferred.
Once you complete the payment for MojoLeaf.com or any other domain, you will have access to our Domain Transfer Center where you can initiate the Domain Transfer. Our Domain Transfer Specialists will assist you with transferring the domain to the registrar of your choice. Typically most transfers are initiated within 24 hours of domain purchase. Learn more about our Domain Transfer Process
MojoLeaf.com and other names on Atom Marketplace do not include Trademarks or business registration. This is because Trademarks are unique to the industry (class) as well as country of the business. Since MojoLeaf.com can be purchased by anyone for any use, it would not be possible for us to file a Trademark in advance.
We recommend that you do some research and/or seek legal advice to ensure that the name you are interested in does not have a direct Trademark conflict by a competitor in your industry and within your region. If there is no direct conflict, or the existing trademark is unrelated to how you plan to use it, then you have a good chance of being able to trademark the name yourself. If there is an existing trademark, keep in mind that, as long as your business is in a different industry, you may still be able to file a trademark for the name.
We also offer a Trademark validation & Filing service which includes upfront Trademark validation and filing the Trademark application on your behalf by a licensed Trademark Attorney.
If for some reason you do not wish to move forward with the purchase of MojoLeaf.com, you are entitled to a refund as long as following conditions are met:
Note: The refund may be subject to cancellation fees. See our Terms of Domain Purchase
In order to purchase the domain, you only pay a one-time cost. However, once the domain is transferred to you, you will need to renew it on a yearly basis with your Domain registrar. The yearly renewal fees are paid directly to the domain registrar and are typically about $10 USD per year for .com domains. The renewal fees may be different for other domain extensions such as .io, .xyz etc.
All domain purchases are backed by our Purchase Protection Guarantee. With over 50,000 customers worldwide, Atom.com has been featured in the Inc 5000 list of fastest growing companies for 3 consecutive years.
We initiate most domain transfers within 1 Business day of purchase. If, for any reason, we are unable to transfer the domain to your ownership, we offer a 100% refund.
Several of our domains offer payment plans, which allows you to make smaller monthly payments to purchase the domain. This is a great option if you are looking to minimize your upfront costs.
The domain will stay with Atom until you have completed all payments. However you can begin using the domain immediately after your first payment. Our team will assist you with any changes to the Domain settings. Once the domain has been fully paid off, we will transfer the domain to your ownership.
You also have the option to cancel the payment plan at any time. Learn more about How Payment Plans Work.
Speak with an Atom platform expert to learn more and get your questions answered.